Pyllar Features
Syntax
Pyllar uses the full power of the Python programming language to offer easy to read procedural or object oriented programming.


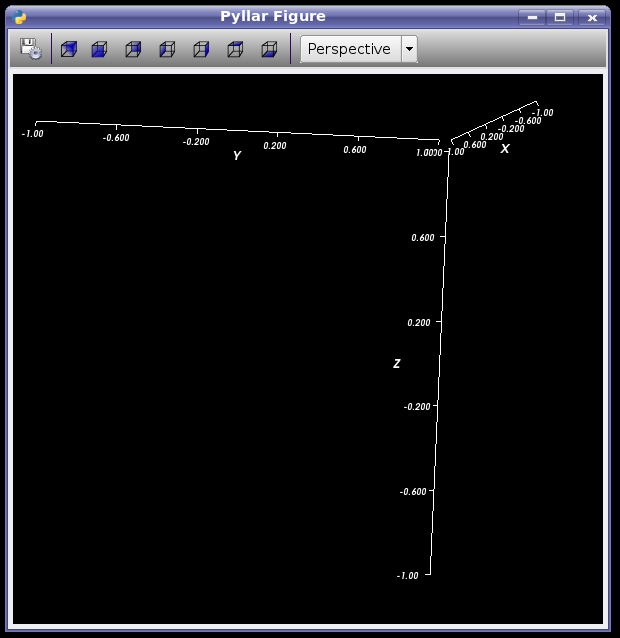
Figure Window
The Pyllar figure window is the window that houses the Pyllar user interface and renderer. The user interfac is made with wxPython and features controls for exporting the figure to a bitmap, controlling the position of the camera, and changing the camera perspective. Using mouse controls, the user can dynamically rotate, zoom, and pan the plot.

Scatter Plots
The simplest form of 3D plot if the scatter plot, showing points in 3D space. Scatter plots are instances of the Plot3 class, and can be made with the plot3 function.

Line Plots
Line plots are also instances of the Plot3 class. They are formed by connecting points together and can have various sizes, colors, and styles.The following plot also shows the experimental grid system for the axes.

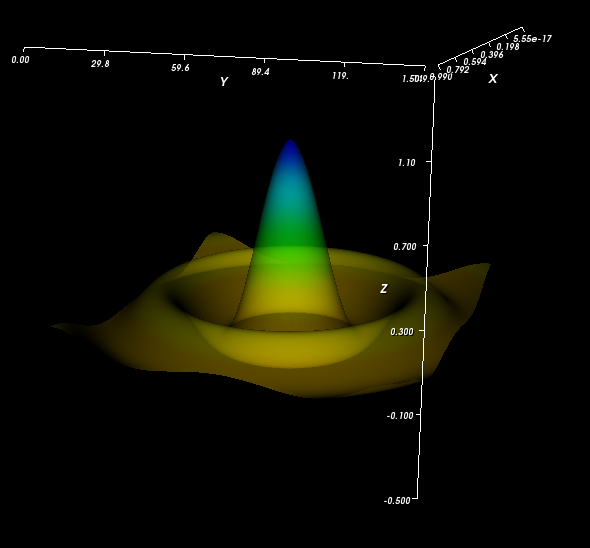
Meshes
Surfaces of rectilinear data (meshes) can be plotted with instances of the Mesh class. Either single colors or colormaps (shown).

Shapes
Many basic geometric shapes can be generated automatically with Pyllar. These include cones, spheres, cylinders, and boxes. The color, opacity, and orientation of each shape can be set.

Hosted by: